© 2024. All rights reserved.
© 2024. All rights reserved.
In an effort to support the planning and response efforts for the recent Coronavirus pandemic, the Network Systems Science and Advanced Computing (NSSAC) division of the Biocomplexity Institute and Initiative at the University of Virginia has prepared a visualization tool that provides a unique way of examining data curated by different data sources.
| Jump to: Publications | Tutorials | FAQ | Update/Release Notes |
For a quick overview, please see the video below:
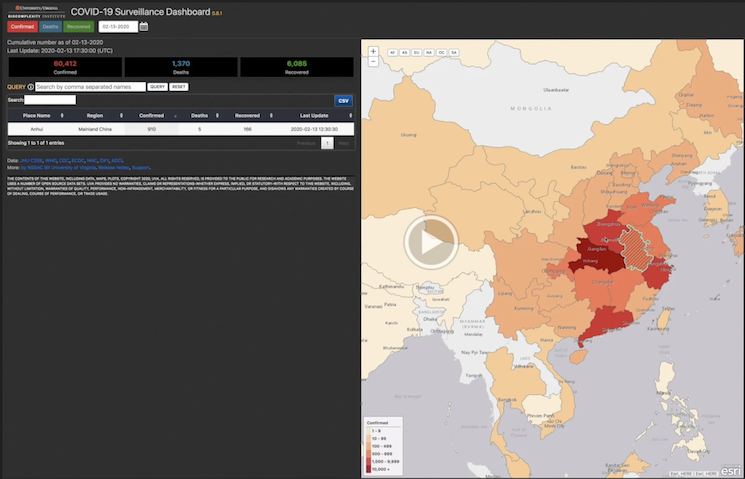
Key features of our tool include:
We hope our tool will encourage researchers worldwide to explore the surveillance datasets made available by The New York Times, USAFacts, The COVID Tracking Project, the World Health Organization (WHO), Wikipedia, and JHU (for Mainland China data).
Supported Browsers: Firefox, Google Chrome, Internet Explorer, Safari, iPad and mobile.
A Peddireddy, D Xie, P Patil, ML Wilson, D Machi, S Venkatramanan, B Klahn, P Porebski, P Bhattacharya, S Dumbre, M Marathe: From 5Vs to 6Cs: Operationalizing Epidemic Data Management with COVID-19 Surveillance. IEEE BigData 2020, December 10-13, 2020, Virtual Event, USA. A preprint version can be found here at medRxiv.
D Xie, P Patil, J Schlitt, D Machi, ML Wilson, B Klahn, A Peddireddy, A Bura, C Mao, E Raymond, YY Baek, H Mortveit, J Chen, J Goldstein, P Porebski, P Bhattacharya, PA Telionis, S Venkatramanan, S Eubank, B Lewis, M Marathe, C Barrett: COVID-19 Surveillance Dashboard. Techinical Report, BI-TR# 2020-06, Biocomplexity Institute & Initiative, University of Virginia. pdf
Due to some limitations of the underlying datasets, active and recovered are not available for all subregions and they may not be accurate in some cases. This is why we changed the default view to be Confirmed, but you can still use Recovered or Active to render the map. We are planning to compute estimated Recovered values and use them to replace Recovered in a future release.
We used data from WHO for most countries/regions up till June 9, 2020 in which the number of recovered was not available. Starting from June 10, 2020, we use different data sources in which the number of recovered for most countries/regions are reported.
The CDC adjusted their guidance on the reporting of deaths on April 14th to include probable COVID-19 deaths in addition to confirmed deaths. It is taking some states time to update their reporting, and some are accounting for past probable deaths in different ways.
The guidance from the CDC is as follows:
“As of April 14, 2020, CDC case counts and death counts include both confirmed and probable cases and deaths. This change was made to reflect an interim COVID-19 position statement issued by the Council for State and Territorial Epidemiologists on April 5, 2020. The position statement included a case definition and made COVID-19 a nationally notifiable disease.
“A confirmed case or death is defined by meeting confirmatory laboratory evidence for COVID-19. A probable case or death is defined by i) meeting clinical criteria AND epidemiologic evidence with no confirmatory laboratory testing performed for COVID-19; or ii) meeting presumptive laboratory evidence AND either clinical criteria OR epidemiologic evidence; or iii) meeting vital records criteria with no confirmatory laboratory testing performed for COVID19.”
More information on CDC guidance can be found here.
The confirmed counts as reported are based on the total number of confirmed cases that have been collected via various sources. The total number of individuals infected at any given time is likely to be a much larger number and is hard to estimate at the present moment. The same is true for total number of recovered individuals.
The time zone for our “Last Update” column is Coordinated Universal Time (UTC).
To download the latest complete dataset:
To download the data for a specific day and region:
You are welcome to use data from our application, provided that:
Per our disclaimer, UVA provides this data for academic or research purposes, and UVA provides no warranties, claims, or representations regarding this dataset.
For our full legal disclaimer:
Copyright © 2023, UVA; ALL RIGHTS RESERVED. THE CONTENTS OF THIS DASHBOARD–INCLUDING DATA, MAPS, AND PLOTS–IS PROVIDED TO THE PUBLIC SOLELY FOR RESEARCH AND ACADEMIC PURPOSES. UVA PROVIDES NO WARRANTIES, CLAIMS OR REPRESENTATIONS–WHETHER EXPRESS, IMPLIED, OR STATUTORY–WITH RESPECT TO THIS DASHBOARD, INCLUDING, WITHOUT LIMITATION, WARRANTIES OF QUALITY, PERFORMANCE, NON–INFRINGEMENT, MERCHANTABILITY, ACCURACY, ADEQUACY, VALIDITY, RELIABILITY, COMPLETENESS, OR FITNESS FOR A PARTICULAR PURPOSE, AND DISAVOWS ANY REPRESENTATIONS OR WARRANTIES CREATED BY COURSE OF DEALING, COURSE OF PERFORMANCE, TRADE USAGE OR OTHERWISE. UNDER NO CIRCUMSTANCES WILL UVA HAVE ANY LIABILITY FOR ANY LOSS OR DAMAGE INCURRED AS A RESULT OF THE USE OF THIS DASHBOARD OR RELIANCE ON ANY INFORMATION PROVIDED HEREIN. THIS DASHBOARD MAY INCORPORATE DATA OR OTHER CONTENT BELONGING TO OR ORIGINATING FROM THIRD PARTIES. WE DO NOT WARRANT, ENDORSE, GUARANTEE, OR ASSUME RESPONSIBILITY FOR THE ACCURACY OR RELIABILITY OF ANY THIRD-PARTY INFORMATION.
Back to: Top
The COVID-19 Surveillance Dashboard has been providing researchers, policymakers, and the general public with daily updates on confirmed cases, deaths, and other metrics since early 2020. However, as the pandemic shifts to its endemic phase, many of the underlying data sources we rely upon are ending their COVID-19 surveillance. While we plan to provide updates to the COVID-19 Surveillance Dashboard until the end of the US Public Health Emergency, the regional coverage and accuracy of the metrics may decline in advance of our official end date due to the decrease in supporting data sources.
The COVID-19 Dashboard will be maintained indefinitely for historical purposes, but surveillance updates will end soon.
We released version 1.6.0 today. In this release, users can toggle to view and download COVID-19 vaccination data. The data source is Our World in Data; one limitation of this dataset is that it does not cover all the regions in the world, so the total for All Regions is likely to be lower than the actual total.
We released version 1.5.3 today, which includes a new tab called “Spatial Temporal” (only available for the United States). In this tab, we show the number of new cases per week in chart and map format. Users can choose to view this information for USA, a specific HHS region, or at the county level for a selected State. To access this feature, select “United States” from the region drop down menu at the top of the page or click on a US State on the map.
The Download feature is available again! See Tip #4: data download for a tutorial. (The User Interface has changed slightly since the tutorial was made, but the functionality is the same.)
We released version 1.5.2 today, and it’s a data release. In particular, for U.S.A. data, we have switched from 1point3acres to The New York Times in order to enable more frequent updates. In addition, we expect to re-enable download option once we conclude our review of the New York Times’ data-sharing policies.
We released version 1.5.1 today, which includes a new tab called “Analytics”. Users can type a query/question into the provided textbox, then click on the “Analyze” button or press the enter key to see the result. Typically, a query/question should include three parts:
Some examples you can query are:
We released version 1.5.0 today, which includes the following improvements:
Because reported recoveries are not available for some regions, we are calculating “Estimated Recovered” values to replace reported recoveries.
Estimated Recovered is calculated as
estimate = (81% of confirmed cases from 14 days ago + 14% of confirmed cases from 28 days ago + 5% of confirmed cases from 42 days ago ) – Deaths
Estimated Recovered = the greater value (reported recovered, estimate)
References:
A WHO study says mild cases recover in 14 days, and severe or critical from 3-6 weeks.
According to the CDC, 81% of COVID cases are mild cases, 14% are severe and 5% are critical. Paper cited by the CDC is here.
We are using “Estimated Active” number as the default rendering option.
We added “New Confirmed” and “New Deaths” to the data table to indicate changes in Confirmed Cases and Deaths relative to the previous day.
In order to stay in compliance with the data sharing policies of some of our upstream data sources, we were required to disable the download option on 06/15/2020. We apologize for any inconvenience this causes.
Today we are happy to announce the release of version 1.4.0 of our dashboard! In this release, we add state/province-level rendering for 18 countries: Argentina, Austria, Brazil, Belgium, Canada, Chile, Colombia, Germany, Greece, India, Italy, Mexico, Peru, Portugal, Saudi Arabia, South Korea, Sweden and Switzerland.
Note: due to limitations of some of the underlying datasets, some categories of data (Active, Deaths, and/or Recovered) are not available for all subregions; unavailable data is tagged as “NA”. Data sources are listed by country: India, Canada, Greece, Colombia, Other Countries
We released version 1.3.3 today which includes a few improvements:
We released version 1.3.2 today which includes a few improvements:
We are committed to our users’ feedback. In version 1.3.1, we brought back the region selector.
Today we are happy to announce the release of version 1.3.0 of our dashboard! The new features that are the hallmark of this release include:
As of today, we provide state/province-level statistics for 14 countries: China, Argentina, Austria, Brazil, Belgium, Canada, Chile, Colombia, Germany, Greece, India, Italy, Peru and South Korea. Note: China was in the list from the application’s inception, and that’s why it’s listed first above.
In version 1.4.0 (version 1.3.0 will be released next week, stay tuned), we will add state/province-level map/rendering for the new countries in the list above. As we shared before, we are committed to our data format: once it’s set, we will not change it. In this coming release, there will be a new feature layer to hold the map for states/provinces for the new countries and the proposed data format is:
Name, Region, Confirmed, Deaths, Recovered, Last Update, ID
Note: the ID is globally unique. The reason we plan to add/use an ID column is obvious: the name column is not unique when we support more countries at this level.
Please contact our support team at nssac_ncov_support@virginia.edu if you have suggestions or comments about our latest release!
We are happy to release version 1.2.0 (this project conforms to Semantic Versioning 2.0.0 from v1.2.0 onwards) of our dashboard! This release features the following enhancements:
To make it easier for our users to find USA County-level information, starting today the County-level information is sorted by county name.
We are committed to our data format, we have not and will not change our data format. Our current data format is:
name,Region,Last Update,Confirmed,Deaths,Recovered
In a coming release that supports USA County-level rendering, the data format will be:
County Name, State Name, Confirmed, Deaths, Recovered, Last Update, FIPS
The reason we plan to add Federal Information Processing Standards (FIPS) is because we want to make it easier for everyone to join our data with other data sources.
Currently we show County-level data in the State’s pop-up Window, but we are planning to remove this information in the future. Please adjust your code if you need to use County-level data. Please contact our support team at nssac_ncov_support@virginia.edu if you have concerns about this planned change, and we will work with you to ensure a smooth transition
With the new release of the version 1.1.4, we decided it was time to update our training video. We hope you find it helpful!
We are happy to release version 1.1.4 of our dashboard. New features in the v1.1.4 release:
As of 03/20, we only show recovered totals for the United States as a whole. At the state level, Active = Confirmed - Deaths and we plan to address this in a future release.
We are happy to release version 1.1.3 of our dashboard. New features since the v1.1.0 release:
We are happy to release version 1.1.0 of our dashboard. New features since the v1.0.0 release:
Please help us spread the word!
We are happy to release version 1.0.0 of our dashboard with a time slider and interactive chart which makes it easy to see all the historical data for the COVID-19 outbreak. It also makes it easier to spot data issues. Please let us know if you find any issues with the tool or the underlying data. Thanks!
We are happy to release our first official version – version 0.8.0 – today. In addition to UI improvements throughout the app, we now offer support for mobile browsers.
Initial Beta release of the system
Back to: Top